FEDEARATION- SMOKEPING, PINGER INTEGRATION
INTRODUCTION
SLAC (Stanford Linear Accelerator Center), Internet2, and other scientific institutes submitted a proposal under the name of “Measurement and Analysis for the Global Grid and Internet End-to-end Performance (MAGGIE)” to the United States Department of Energy (DOE). The main goals of this proposal are to build a federation of measurement infrastructures so that latency measurements (historical and recent) can be shared, best practices among several measurement infrastructures can be adopted, the need for sites to deploy multiple infrastructures to gain all the available benefits be reduced and different analysis and visualization techniques be applied to yield more ubiquitous coverage and new insights. This project “Federation-SmokePing, PingER Integration” serves the main ‘MAGGIE Project’ and deals with the integration of two network latency measurement tools namely SmokePing and PingER.
The objectives of the project include:
1. Study and evaluate SmokePing and PingER to understand how they work, and their pros and cons.
2. Extend the capability of SmokePing to derive parameters/metrics not currently supported such as ping unreachability, jitter, derived TCP throughput, etc.
3. Provide the ability to select and visualize these new metrics. Feed the modifications to SmokePing back into the development base.
4. Modify PingER to enable it to utilize the SmokePing time series visualization tool.
5. Evaluate
and provide the ability to feed SmokePing data to the Pinger
analysis/visualization toolkit, so we can use the PingER aggregation
techniques to characterize performance by regions, or affinity groups.
The work that has been done with respect to each objective and the results yielded are as follows:
1. Results Obtained from Objective- Working of SmokePing and PingER and the Pros and Cons of Each
Benefits of PingER over SmokePing
|
|
PingER |
SmokePing |
|
Parameters
Measured |
Measures thirteen parameters |
Measure eight parameters |
|
Data Visualization |
Has an elaborate textual and graphical output |
Smoke Ping only provides with graphical results |
|
Data Analysis |
Provides analysis for multiple locations using aggregation techniques to characterize performance by regions, or affinity groups |
Provides analysis for installation location and each remote site separately |
|
Data Storage |
PingER provides
detailed analysis on historical data dating back to greater than 11 years |
SmokePing data is
not kept in a centralized manner |
|
Development And
Improvement |
PingER is being
constantly improved through a focused team |
There is no
official team to upgrade it. Never the less it has a active archive team of
developers and users constantly removing problems and improving the software |
|
Error Reporting |
PingER has error
reporting module |
Does not have error
reporting module |
|
Data Maintenance |
Data keeps on
getting appended at the end of the flat files |
Once the room in
the database finishes, every new data entry causes and overwrite on an
existing database entry in a round robin fashion |
Benefits of Smokeping over PingER
|
|
SmokePing |
PingER |
|
Uptime Visualization |
Uptime is depicted using colors displayed at the background of SmokePing graphs |
No visualization support for dynamic hosts |
|
Alarms |
Generates alarms if performance goes below a certain point |
Does not need nor generate any alarms |
|
Data Resolution |
Stores data in consolidated form after specified time. By default after twelve data sets are filled in the Round Robin Archive, they are combined to form one single data set in another Round Robin Archive. After hundred and forty-four data sets are filled, they are accumulated to form a data set in the third Round Robin Archive of the Round Robin Database. |
Keeps data dating back to 11 plus years on high resolution, therefore it has high data storage requirements ~0.6 MB/pair/month
|
|
Smart Alarms |
Offers plug able alarm modules called 'matchers' which are small Perl modules which examine the past latency measurements and decide if an alarm should be triggered after applying whatever operations necessary to come to a conclusive answer |
Does not need nor provide alarms |
|
Probes |
Offers plug able modules to write application level probes |
Does not work with application level probes |
The objective “Working of SmokePing and PingER and the Pros and Cons of Each Tool” reveals the follow main facts:
§ SmokePing shows network performance by the help of data collected and displayed at near real time. PingER on the other hand visualizes data of a day prior to date, at the analysis sites.
§ SmokePing uses less memory for the same step interval as PingER by consolidating the data as time passes. This happens by default to the data beyond last three hours.
§ PingER has the ability to show output based on hourly, daily, monthly, last 60 days and last 120 days and all monthly aggregation.
§ Using PingER one can characterize performance based on affinity groups and regions. SmokePing only shows data for one link from source to destination in which the source is always the site where SmokePing is deployed.
§ PingER shows thirteen parameters where as SmokePing shows eight. Never the less SmokePing shows at a glance output of the network performance, with important network latency parameters such as packet loss and RTT together in one graph and Smoke depicting the RTT delay variation.
§ SmokePing generates ‘smart’ alarms based on patterns that the administrator of the software specifies. It also mails the admin if the performance goes significantly low. PingER does not generate alarms nor mails and does not need to do so either as its data is not near real time but of a day prior to date.
§ SmokePing shows uptime for dynamic hosts by displaying colors at the background of the graphs. This tells the amount of time a dynamic host was able to keep its IP address. PingER does not display this feature however it does make sure that it is monitoring the correct host using a script that runs automatically on a daily bases.
§ Both the tools are being constantly improved.
Both SmokePing and PingER have their pros and cons. Depending upon what factors one wants to optimize one can choose between the two. For an in-depth and detailed analysis, and to characterize performance based on affinity groups and regions, a large (13) number of network latency parameters, PingER is the correct choice. If one wants at a glance near real time visualization of network performance, smart alarms, application level probes, with few important latency parameters, with monitoring possibility of only links between the installation system and the targets sites, SmokePing is a better choice.
2. Results Obtained from Objective- Enhancement of SmokePing Network Latency Parameters
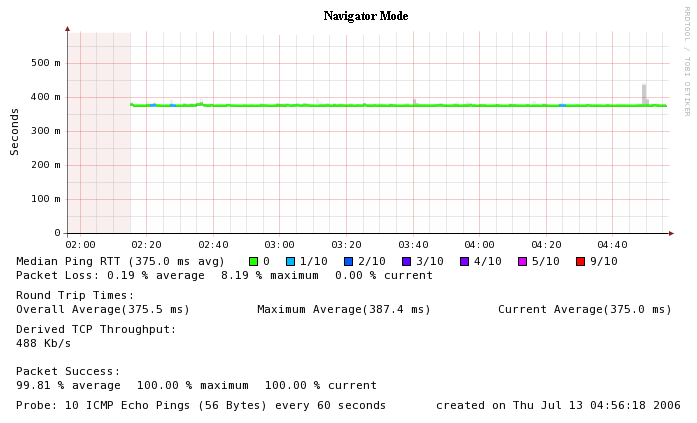
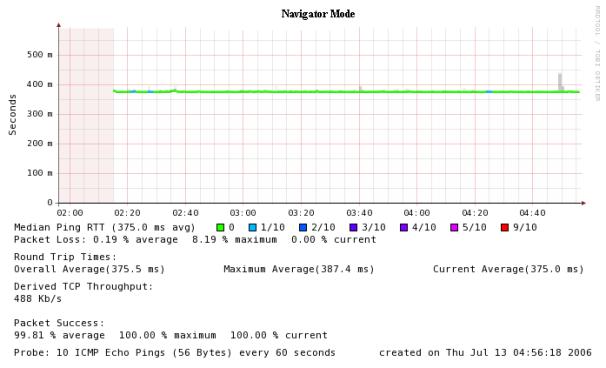
The results of the objective “Enhancement of SmokePing Network Latency Parameters” are that SmokePing functionality has been enhanced with the following 11 parameters:
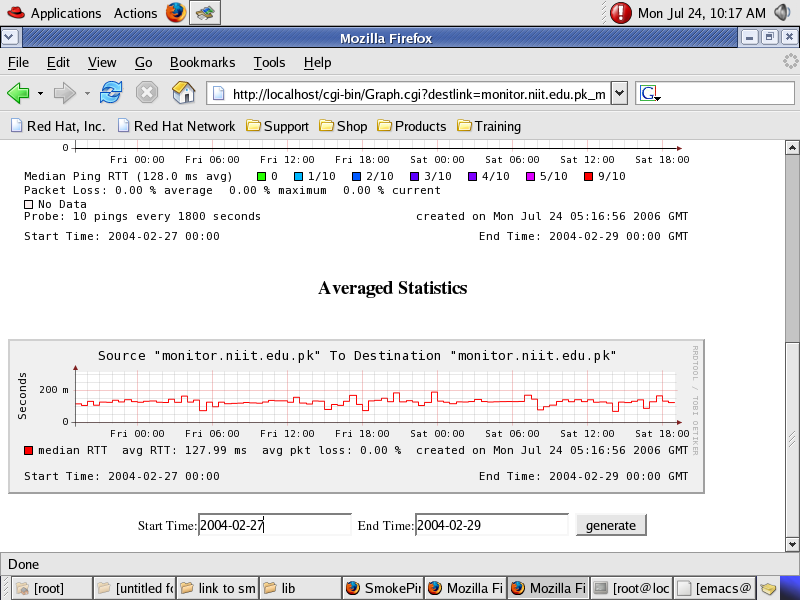
§ The total average RTT for all the ping data in the time interval displayed by the graph.
§ The maximum average RTT that any probe ever reached during the time period displayed by the graph.
§ The average RTT for the last probe received.
§ This is the bounded TCP throughput in Kilobits per second for the link between the monitoring host and the remote host.
§ This is the percentage average success of the ping packets. These are the ones that out of the total packets sent came back.
§ This is the percentage maximum success of the ping packets. These are the ones that out of the total packets sent for any probe during the time range of graph, came back.
§ This is the percentage current success of the ping packets. These are the ones that out of the total packets sent for the last probe came back.
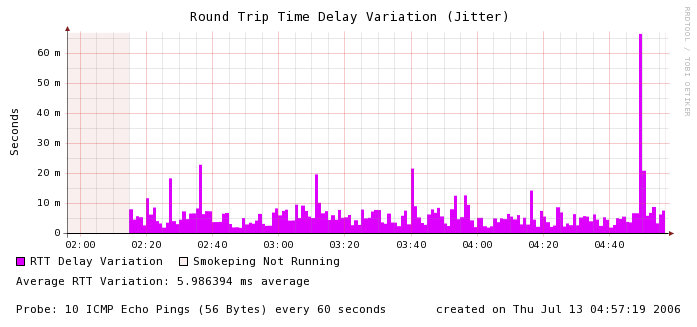
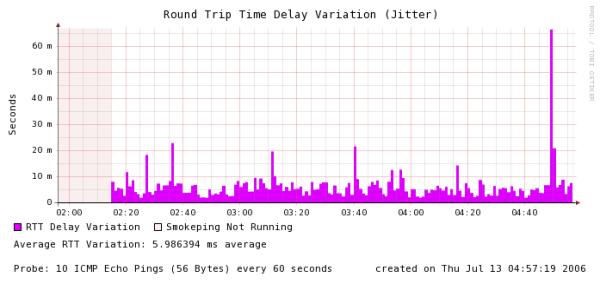
§ This graph displays the RTT variation for a given range of time. It is the difference between the maximum and minimum ping RTT for a probe.
9. Average RTT Delay Variation
§ The overall average RTT variation for the RTT Delay Variation Graph.
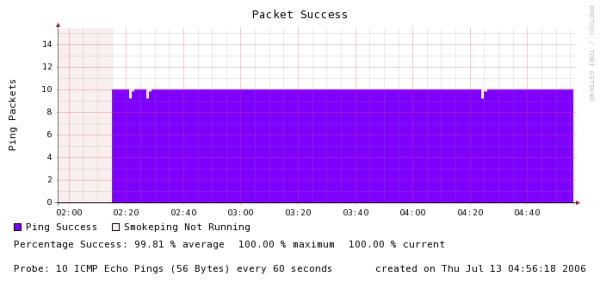
§ This graph displays the packet success percentage against the axis time.
§ This is the minimum packet loss that occurred for any probe in the range of the graph.
More parameters of PingER still need to be integrated into SmokePing. I am looking into the possibility of the integrating all latency measurement parameters as “plug-ins”. For this I had posted my question at the Smokeping Archives a couple of times. I have yet to get a reply.
SmokePing Enhanced Mode Visualization
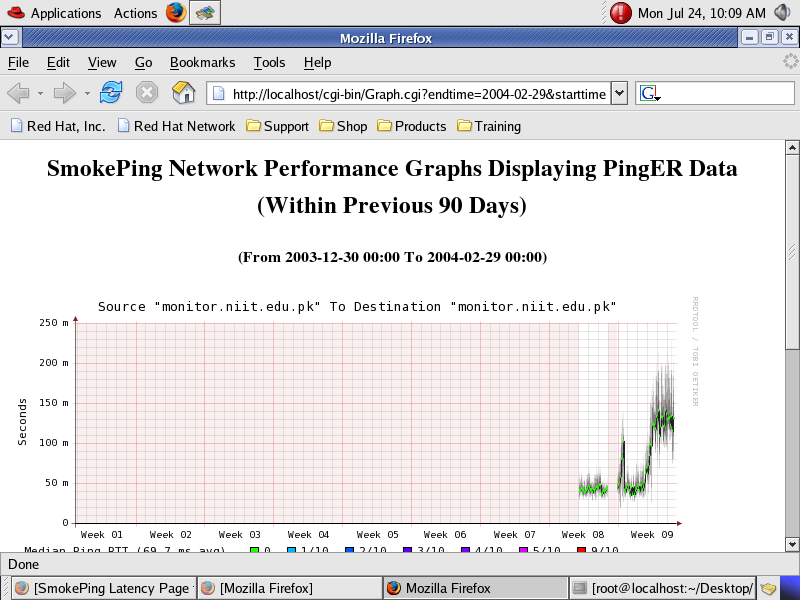
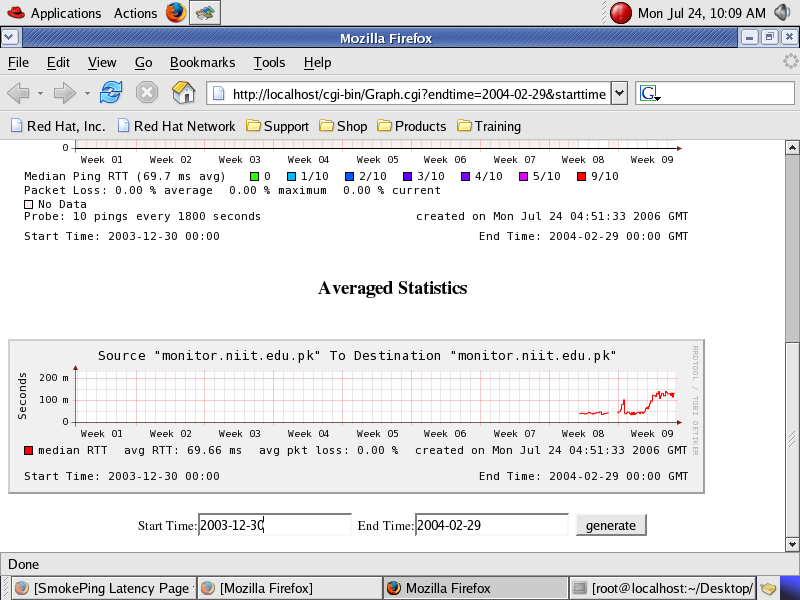
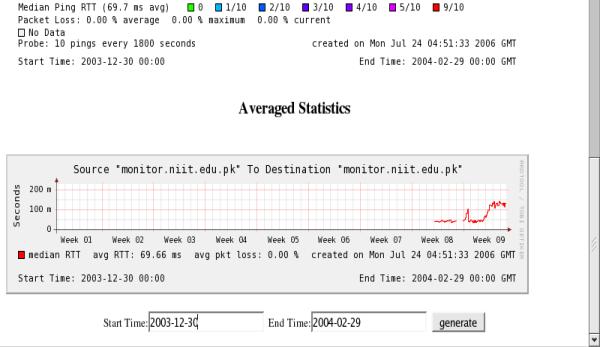
It is possible to convert PingER data into SmokePing format. The data is converted as a cron job on a daily basis. The data is maintained for the past 90 days. Converted data is visualized using RRDTool and developing graph codes. The converted data is displayed in the form of SmokePing Graphs to a user when he visits the “Selection Web page” and clicks on the desired monitoring host, remote host, packet size, pings per probe combination. The user can also plot the converted data by specifying any start and end date and/or time within the past 90 days.
Eventually the user will be able to plot the graphs by clicking on the corresponding monitoring site link present at the website of PingER whose URL is as follows:
http://www.slac.stanford.edu/cgi-wrap/pingtable.pl
This will eliminate the need for the “Selection Web page”.
Right now work is being done to fill the data files using ‘update’ function of RRDTool. This will make the conversion code simpler and more efficient.
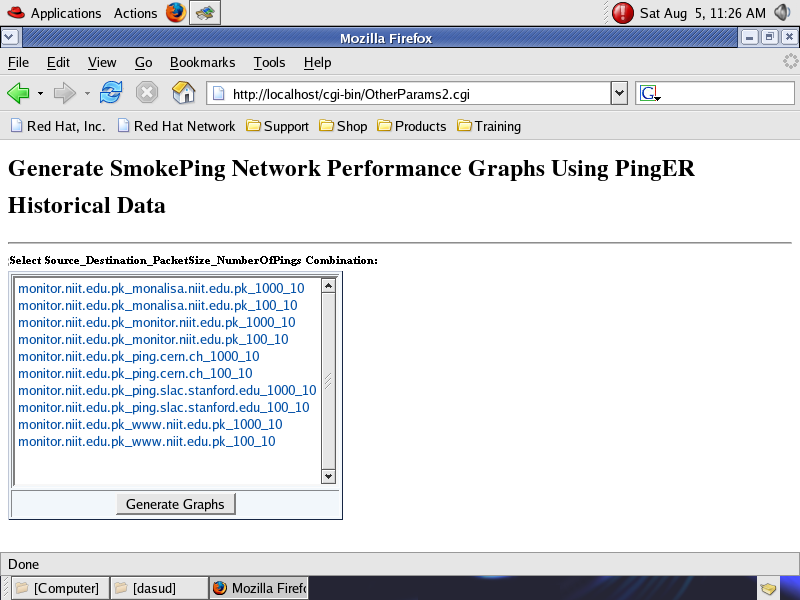
Selection Web Page of ‘PingERtoSmokePing Application’ to Generate Corresponding Graphs
(Please note that current date is considered as 2004-02-30 00:00)
![]()
SmokePing Network Performance Graph of ‘PingERtoSmokePing Application’ Displaying PingER Data Selected from 2004-02-27 to 2004-02-29 from Source Site “monitor.niit.edu.pk” to Destination Site “monitor.niit.edu.pk”